Reporting / supporting platform capability

Connected data. Deeper insights.

Help desk, repairs, and asset management tell a bigger story together. Dream layers these records in one platform to reveal costs, patterns, and performance that separate systems cannot show on their own.
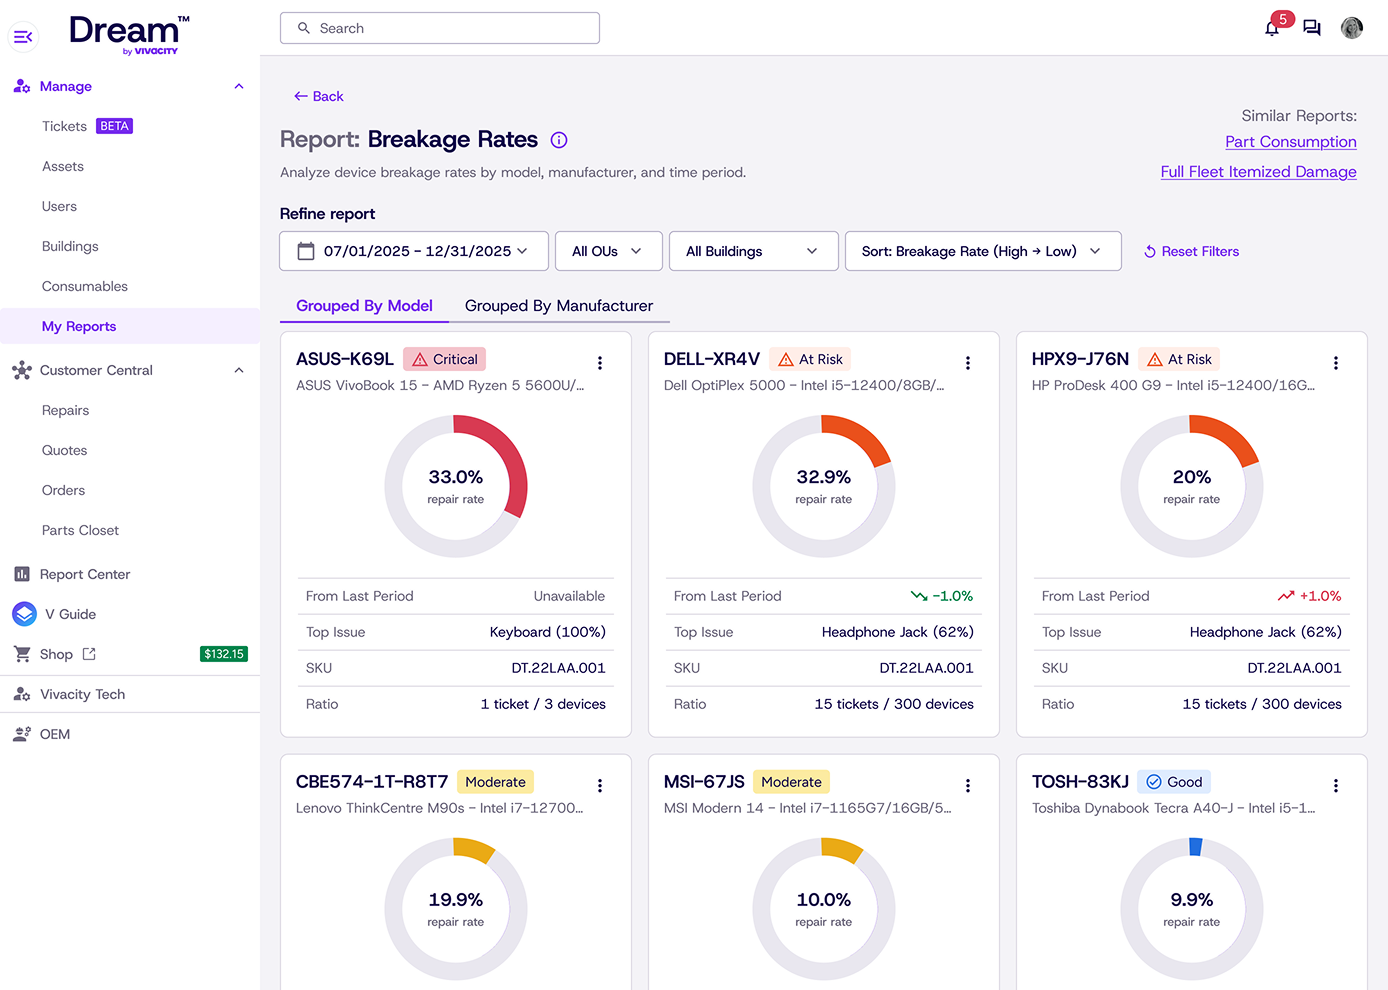
Dream breakage rate report grouping repair rates by device model with trend and top issue
Help desk + repairs + assets Connected records. Shared context. Included free

The problem

Separate systems only tell part of the story.

A help desk shows the issue. A repair system shows the work and cost. An asset tool shows the device, its age, and where it belongs. In separate systems, the relationship between those facts is easy to miss. Dream connects them, so you can see which devices keep generating tickets, what those repairs cost, and where the same problems happen most.

Dream / the way throughDream
Dream repairs report used to justify budget, with repair volume and cost over time

Put repair costs in asset context

Repair totals tell you what you spent. Layer in asset models, age, locations, and ticket history to see where that spending comes from. Compare cost per device, identify repeat repairs, and bring a fuller picture to repair-or-replace decisions.

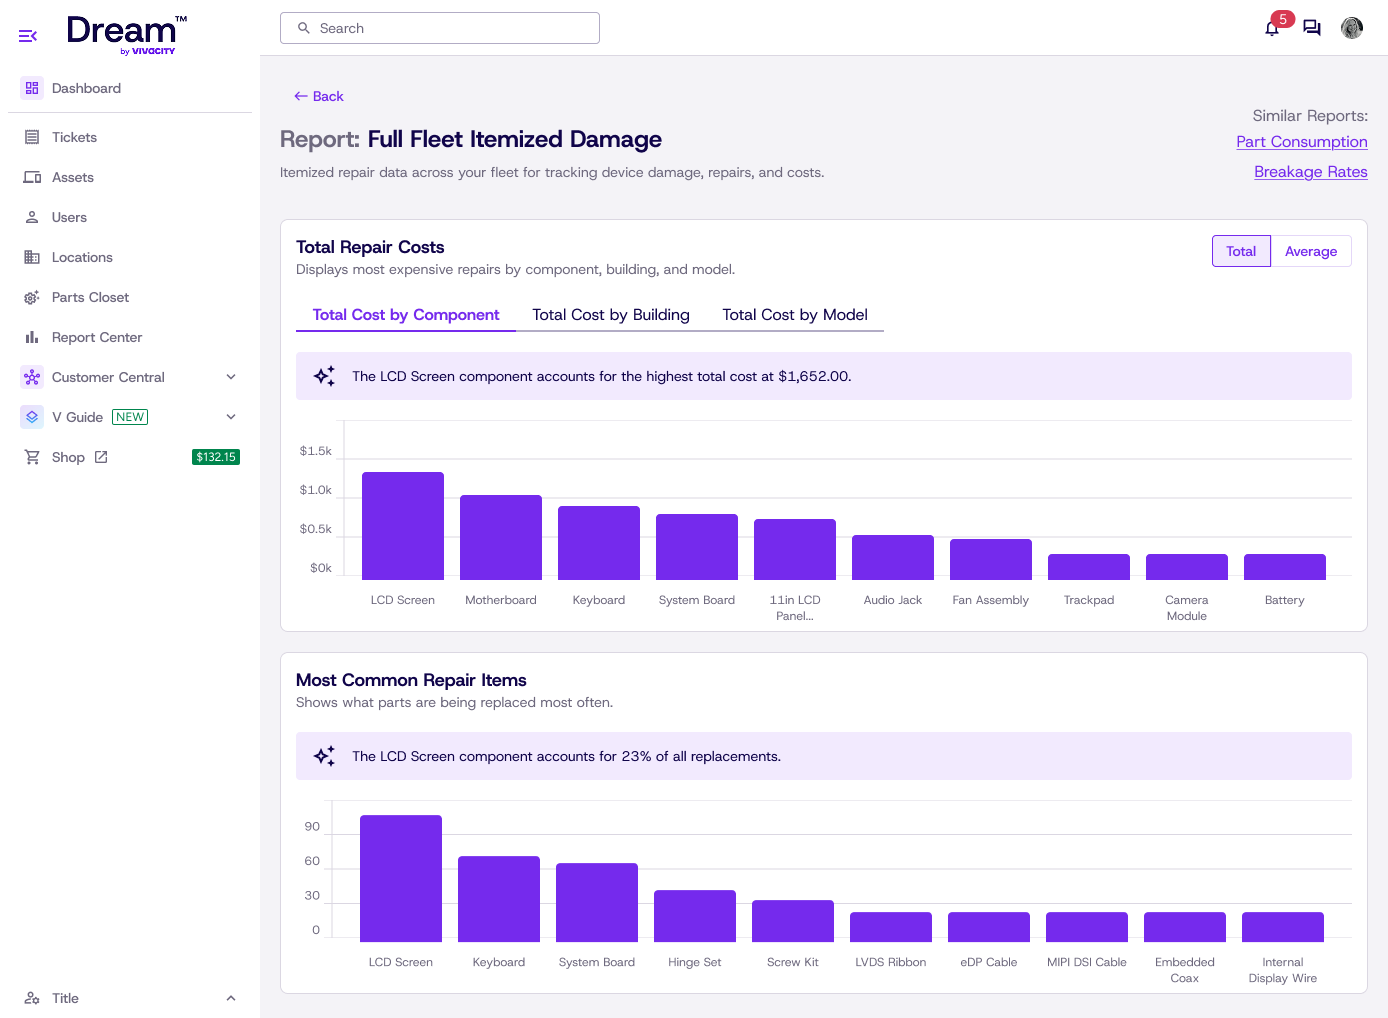
Dream full fleet itemized damage report for the week ahead

See the patterns behind the tickets

A spike in support requests means more when you know the devices involved and their repair history. Look at issues alongside model and location data to distinguish isolated incidents from recurring fleet problems—and focus your team where it matters.

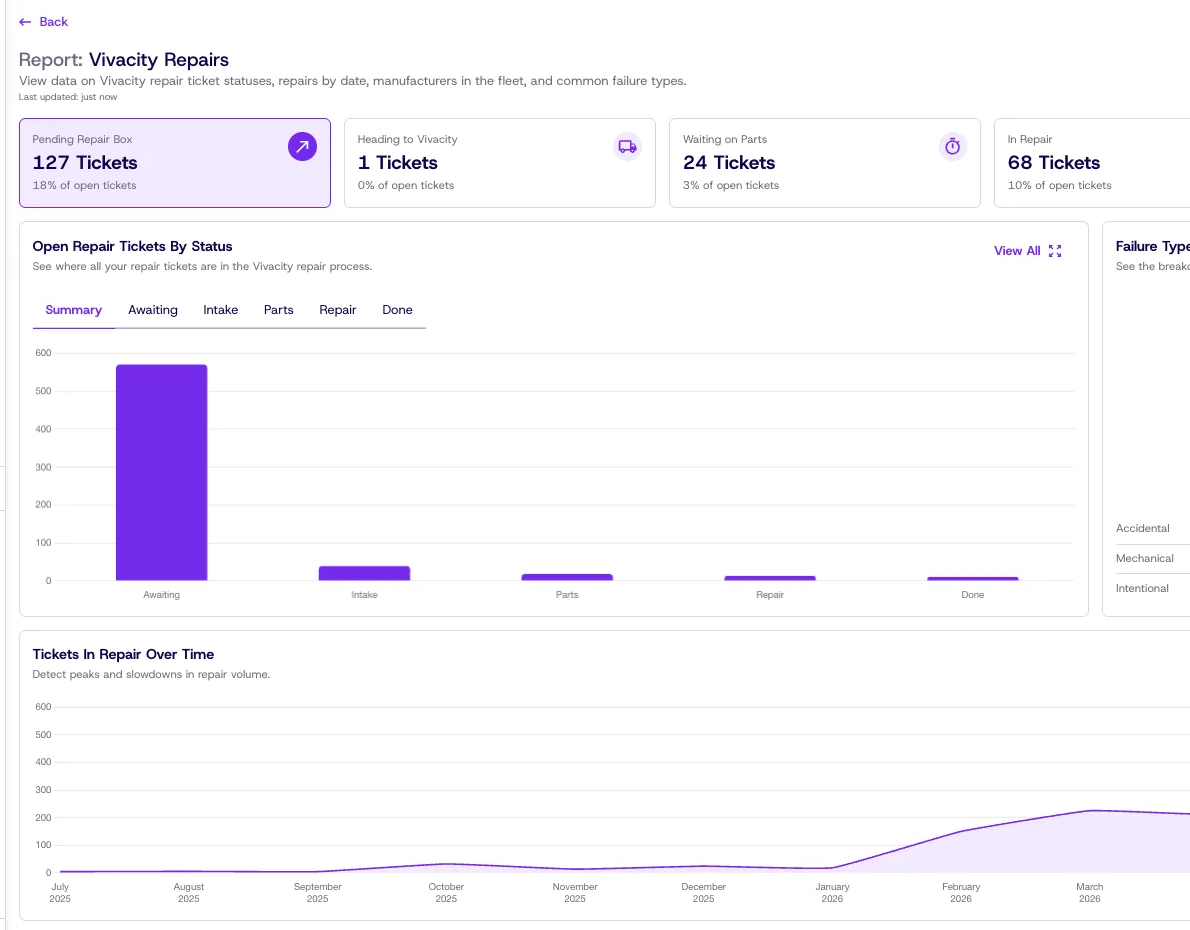
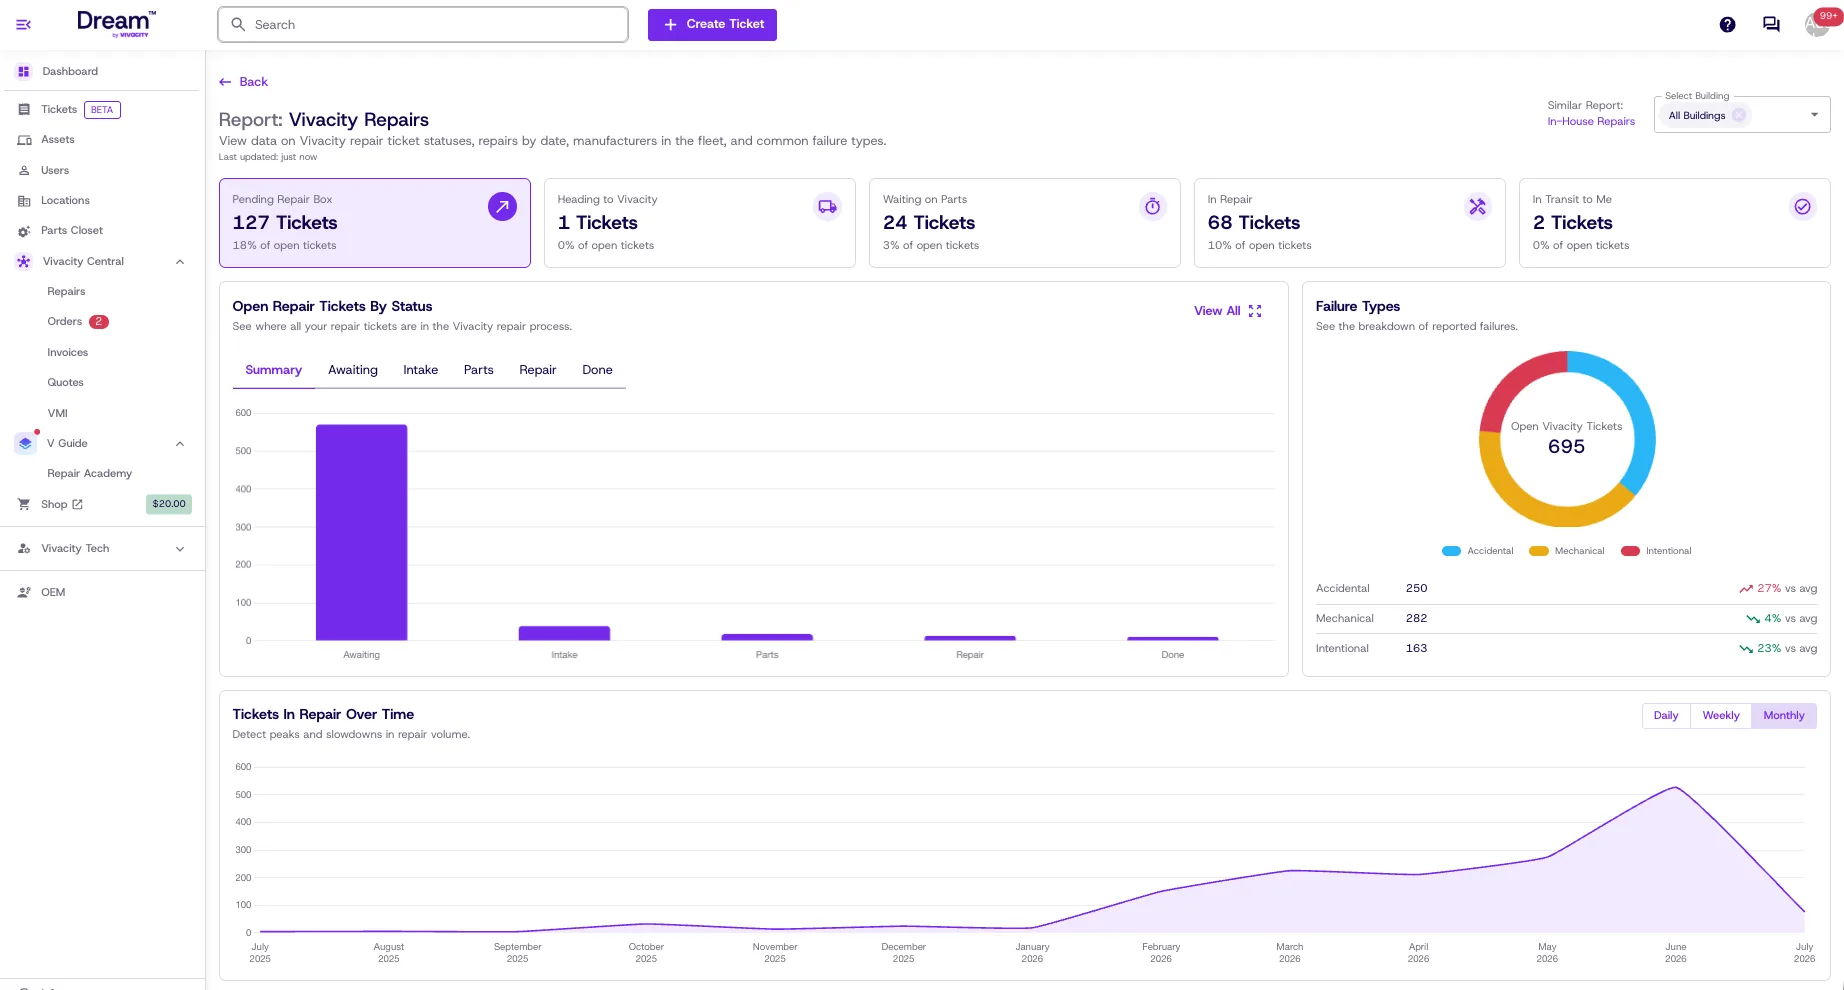
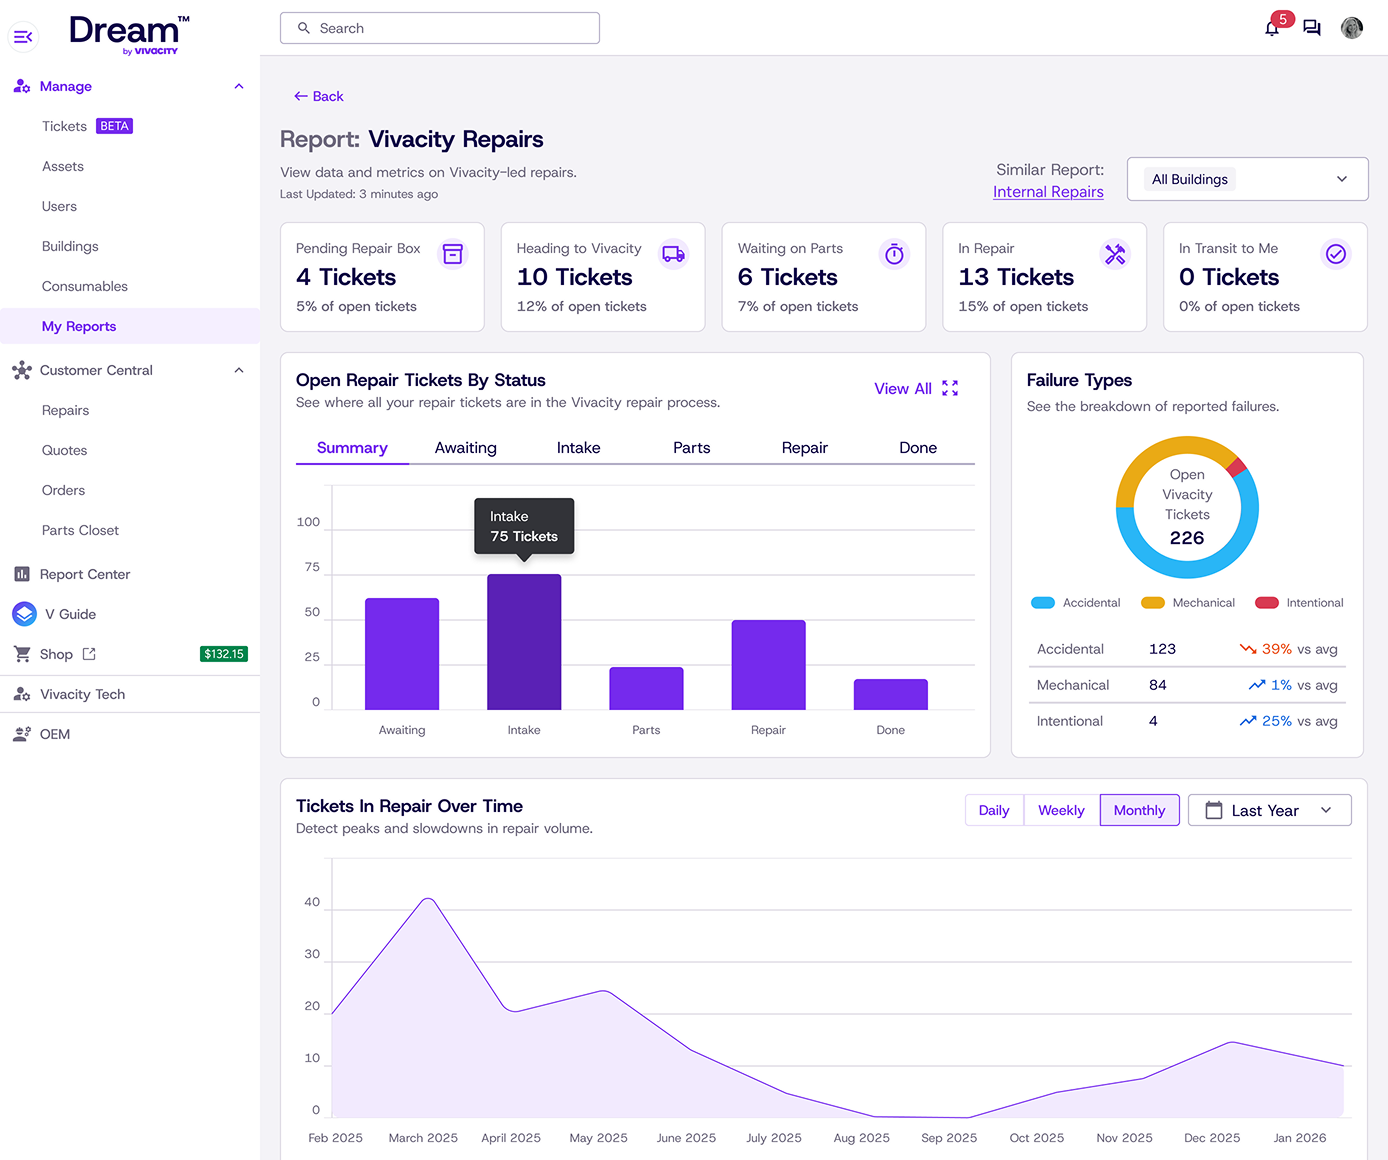
Dream Vivacity Repairs report with ticket status totals, an open repair tickets by status bar chart and a tickets in repair over time chart

Detail · Repairs report chartsView full image

Connect support demand to repair progress

Ticket status is only part of the picture. Read it alongside repair progress and the affected assets to understand what is still open, which devices are in repair, and how that work changes over time. Your team gets context, not just another count.

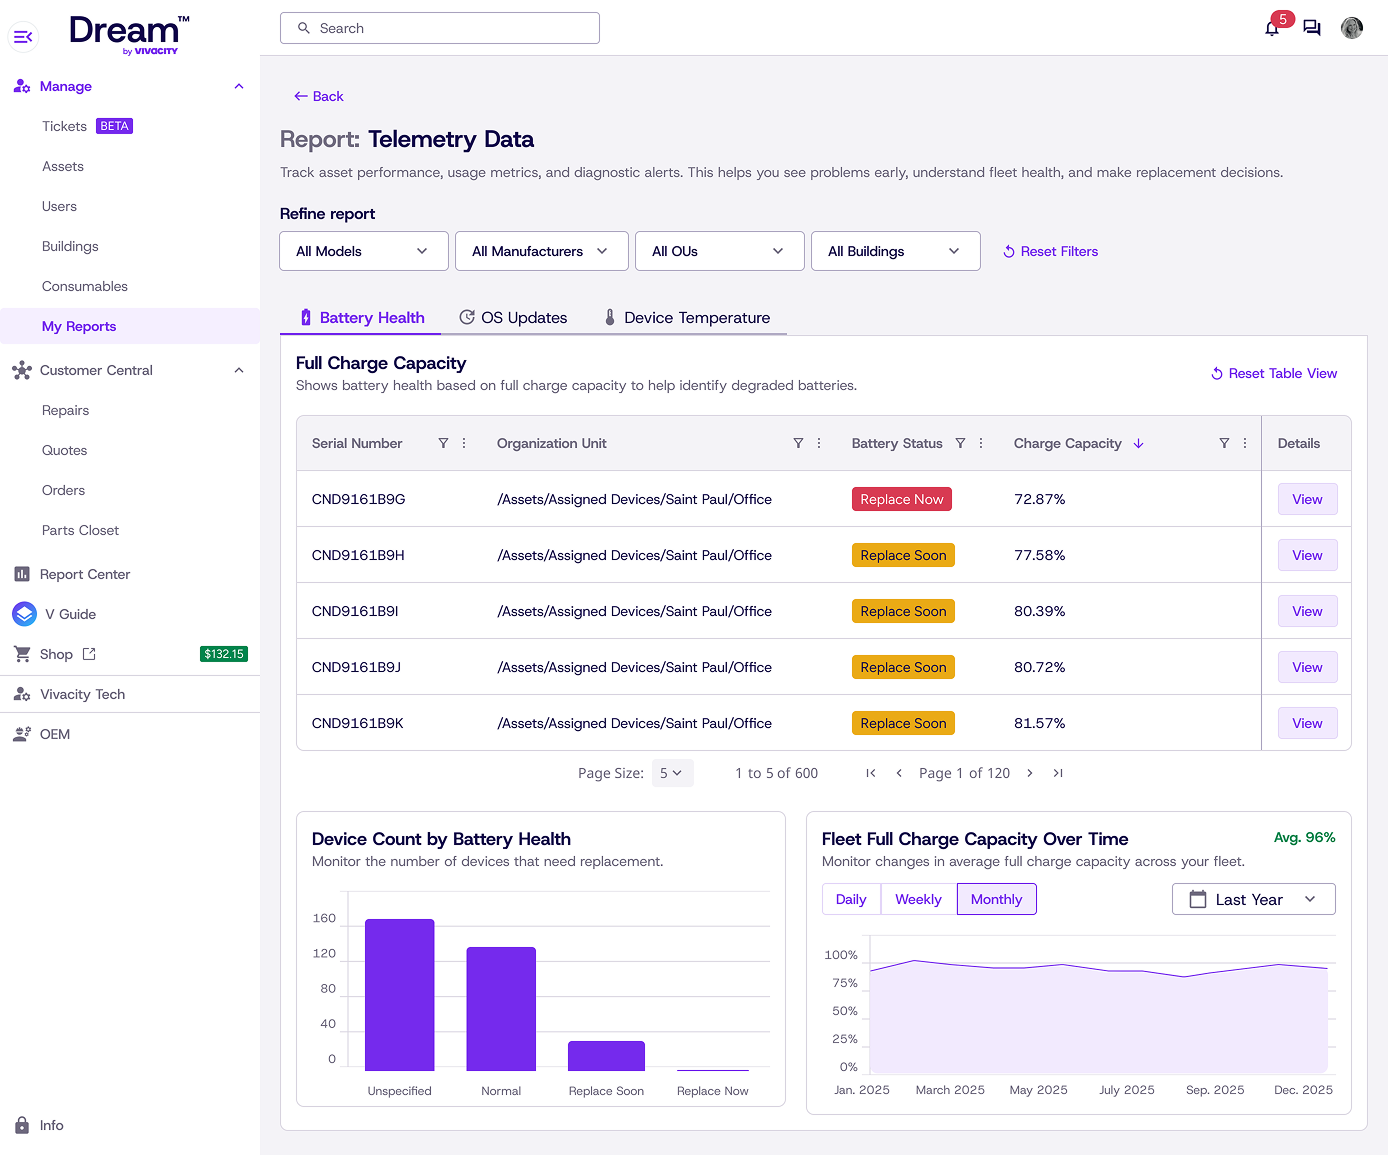
Dream telemetry data report table with device health columns across the fleet

Telemetry data reportView full image

Give fleet health a history

Device health data shows how an asset is performing. Help desk and repair records add what users experienced and what your team did about it. Together, they give you a more complete basis for maintenance, purchasing, and refresh planning.

Connected by design

Three sources. A fuller picture.

The value is in the connection: a support issue tied to a repair, tied to the asset and its location. Dream brings those data points together instead of asking you to reconcile separate exports.

The layers behind an insight

  1. Support context

    Help desk

    The reported issue, its status, and the affected device.

  2. Service context

    Repairs

    The work, parts, and costs behind the resolution.

  3. Fleet context

    Asset management

    The model, age, assignment, and location of the asset.

  4. Combined insight

    Reporting

    Which device models have repeat issues—and what those repairs cost by location.

Insights no single dataset can provide on its own.

“We already have reports in our other systems.”

Those reports show what happens within each tool. Dream connects the support issue, the repair, and the asset, so you can understand how they relate. That shared context is the difference.

See what your data reveals together.

Get Started